Guest editorial, By Albert D. Bates, Director of Research, Profit Planning Group
This article was published in the September 2017 edition of NTEA News.
Most distributors can justifiably feel good about recent operating performance. A growing economy has helped generate reasonable sales growth, enabling businesses to position and plan for the future. However, at the same time, there is continual pressure on gross margins from existing and potentially new competitors, along with upward pressures on costs (particularly payroll) that refuse to go away.
Given this mixed environment, this article addresses three key questions for NTEA distributors:
- How are we doing? (What is the typical level of profitability in the industry?)
- How good can we be? (What results are the most successful companies generating?)
- How can we reach high-profit results? (Which of the critical profit variables appear to drive profitability?)
The first two questions are easily answered by examining the top part of the chart below. These figures present two different measures of profit for both typical and more profitable businesses.
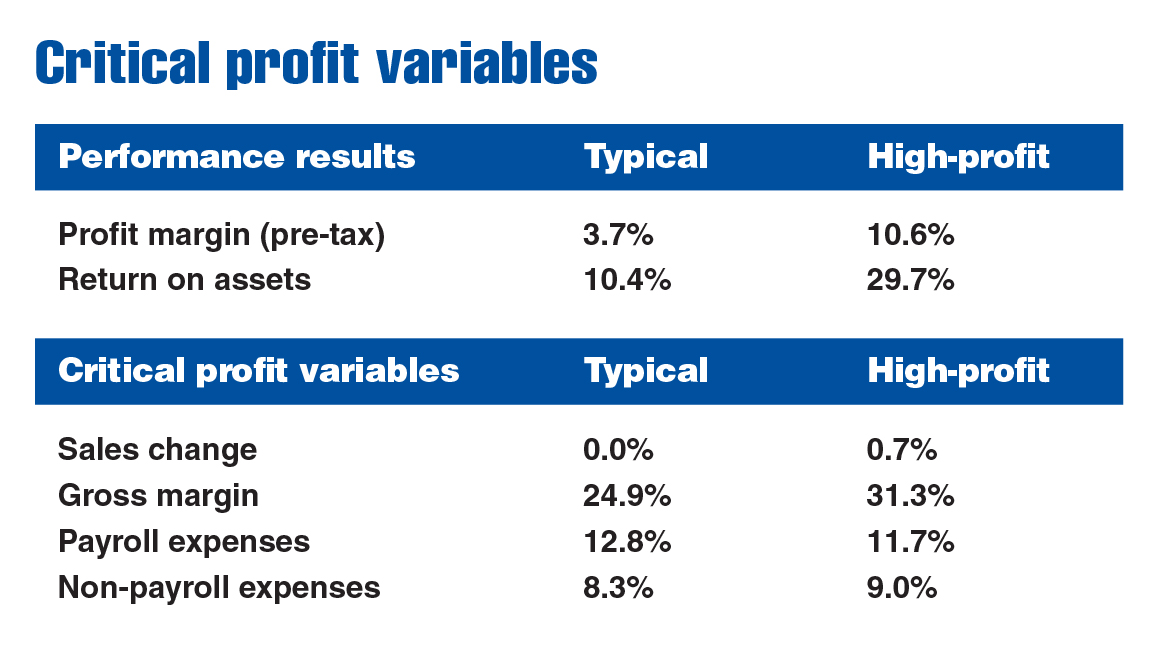
The profit before taxes percentage measures pre-tax profit as a percent of revenue. For the typical company, this figure was 3.7 percent, while high-profit firms enjoyed a 10.6 percent result.
Return on assets calculates the same pre-tax profit figure as a percent of the total asset investment in the business. Again, there was a striking difference with the typical company at 10.4 percent versus 29.7 percent for the higher profit firms.
Critical profit drivers
In trying to move from typical to high-profit, the key is to understand the nature of the critical profit variables (CPVs). Namely, which are most important and how they affect performance.
CPV results for the typical and high-profit businesses are summarized in the bottom half of the chart. A common misconception is high-profit companies must 1) do a lot better than the typical firm and 2) do a lot better in every CPV. Nothing could be further from the truth.
As it turns out, some of the differences in CPVs between typical and high-profit are often extremely small — but they tend to multiply to produce major changes in profit margin.
It may be surprising to learn it’s not necessary to do a little better everywhere. No firm produces superior results for every single CPV in either good times or bad. Successful businesses manage CPV performance to maximize overall profitability. This is great news for the typical firm. Perfection is not required, only blending the CPVs in a positive way.
Sales growth, gross margin, payroll expenses and non-payroll expenses are the most important contributors to enhancing profit. Each factor must be planned carefully to ensure adequate results.
Sales growth
The ideal level of sales growth is in a fairly narrow range. Excessively slow growth certainly creates profit problems, but so does rapid expansion.
Slow sales means expenses, which often tie closely to inflation, outpace the rate of growth (meaning, expenses as a percent of sales increase). While few companies believe so, rapid sales growth is also a problem. Financing it is always a challenge, and operating systems are taxed when growth is too fast.
The “ideal” rate of sales growth that allows businesses to operate without serious financial challenges is the inflation rate plus three to six percentage points. So, if the inflation rate is 2.0 percent, ideal sales growth would be in the 5.0–8.0 percent range. This should be viewed as a minimum. Firms may grow faster, but without basic growth, profit improvement is difficult.
Gross margin
It would seem that as sales growth takes hold, businesses would enjoy a pricing advantage. However, excitement associated with increasing sales tends to cause companies to become lax in pricing control.
In almost every industry, an adequate gross margin is a determinant of profitability. The real driver behind improved, or at least maintained, gross margin performance is continual monitoring.
Gross margin, in turn, is largely a pricing issue. Margin enhancement through pricing changes must involve stretching the price matrix. Distributors can be price-aggressive on fast-selling items, but they tend to underprice slower-selling items. This is a key opportunity to raise gross margin, and is payroll-expense free.
Payroll expenses
Payroll is always the largest expense factor in a distribution business. As a result, controlling it is essential to regulating expenses. Ideally, payroll costs should increase by about 2.0 percent less than sales.
At first glance, controlling payroll growth would appear relatively simple. The reality is a different story. Controlling payroll becomes even more difficult in a growth market. Firms often hire in expectation of greater sales growth. Additionally, the same “eye off of the ball” problem associated with gross margin also takes place with payroll.
Non-payroll expenses
Non-payroll expenses are easiest to control. Most can be brought in line as long as sales are rising faster than inflation. The vast majority of these expenses are directly related to the rate of inflation. As long as sales growth is maintained above the inflation rate, there is the potential to lower the non-payroll expense percentage.
Moving toward high-profit results
High-profit companies produce great results virtually every year. The key to improved performance is to develop a specific plan for each of the CPVs and combine them in a positive way. The goal is not perfection — it is to do a little better across the board.