By Steve Latin-Kasper, NTEA director of market data & research
This article was published in the August 2019 edition of NTEA News.
Key highlights
- Total U.S. truck registrations has grown at a 3.3% average rate since 2014.
- The commercial segment of total truck registrations has increased since 2013, but not as steadily.
- Highway Statistics Series is the only public source of truck registration data that segments totals by private and public economic sectors.

There are many ways to measure the size of the U.S. commercial truck industry. One data source is the Department of Transportation, Federal Highway Administration (FHWA), which publishes Highway Statistics Series annually in January. These reports contain analyzed statistical information on motor fuel, motor vehicle registrations, driver’s licenses, highway user taxation, highway mileage, travel and highway finance. The most recent data available is for 2017; 2018 data is scheduled to be published in early 2020.
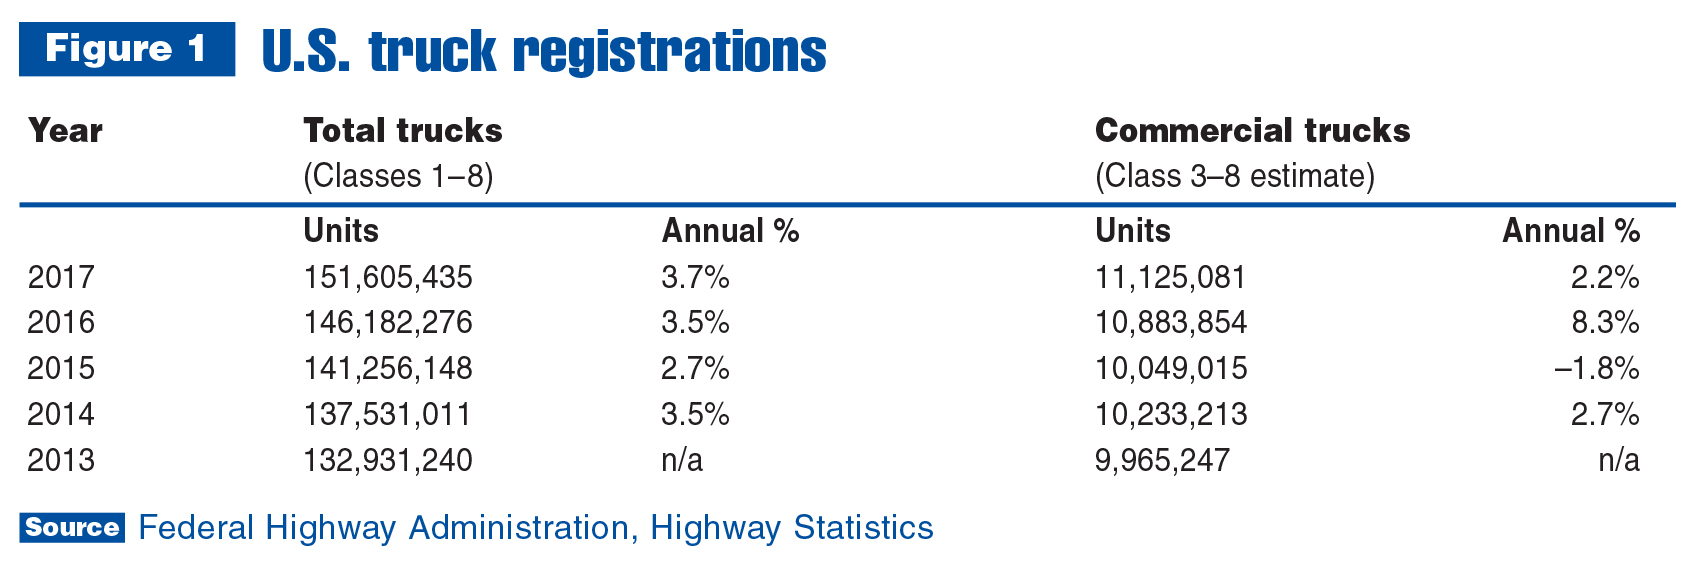
As shown in Figure 1, total truck registrations (number of trucks registered for use in the U.S.) has grown steadily at a 3.3% average rate since 2014. The commercial segment of the total has increased since 2013, as well, but not as consistently. The Class 3–8 commercial truck estimate is the total minus the mostly non-commercial vehicles (pickups, SUVs, passenger vans, and other light vehicles) for which FHWA provides segment data. Tractors are also excluded from the Class 3–8 total.
Data in Figure 1 is a small portion of what is available in Highway Statistics, which is the only public source of truck registration data that segments totals by private and public economic sectors. Private-sector registrations are sectioned for commercial and passenger use. Trucks and tractors are counted separately, as are pickups, SUVs and vans. In addition, all data is segmented by state.
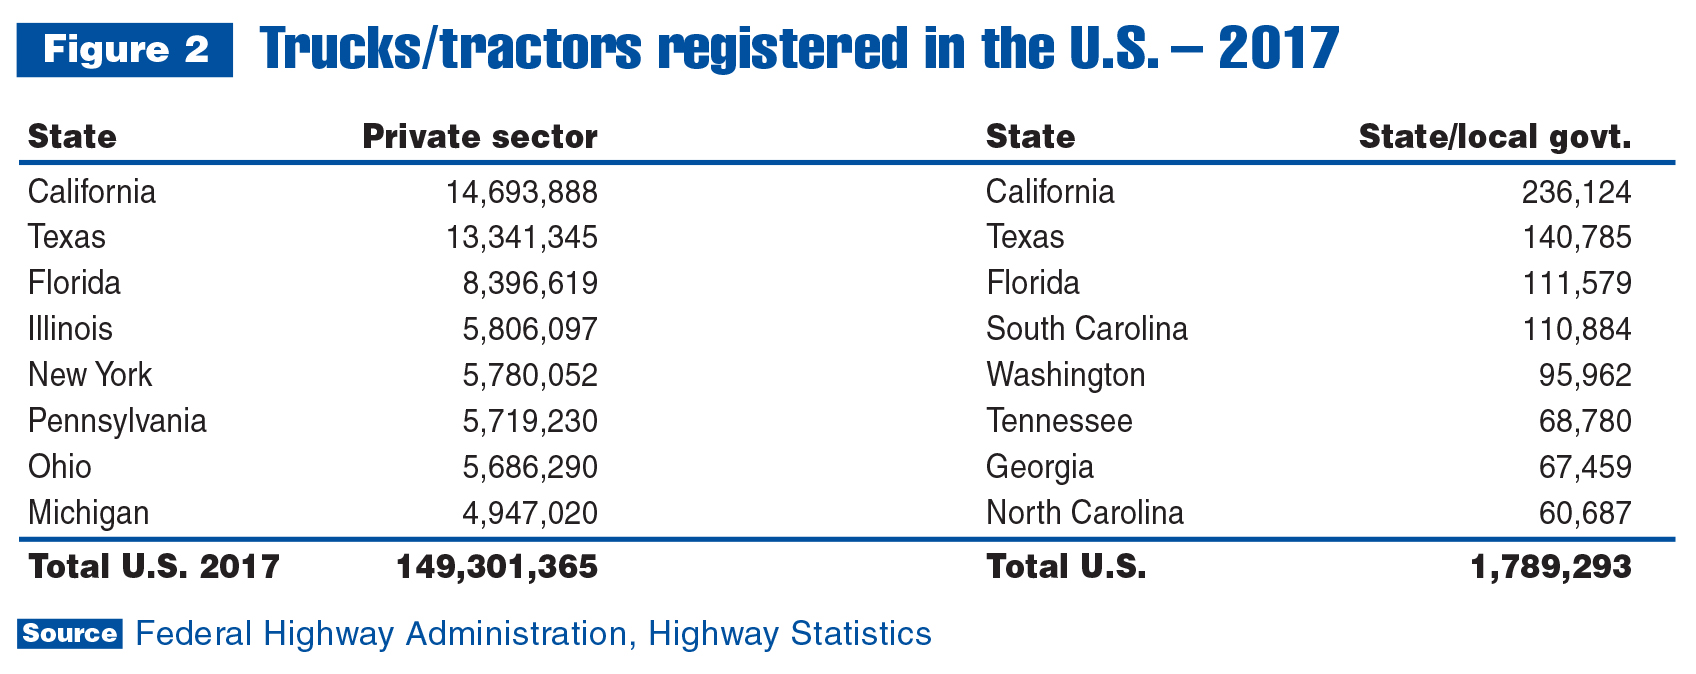
As a result, it’s possible to create charts like Figure 2. The private and state/local segments of the total are presented for the top eight states in each category. Data is also available for trucks/tractors owned by the federal government. Clearly, not all state/local governments consider ownership of trucks and tractors to be better than other alternatives. There are various reasons why some of the top eight private-sector truck registration states are not in the top eight state/local government registrations. Primarily, some states do more of their own highway and street construction, instead of contracting to the private sector.
Bus registration data, which isn’t included with this article, is split into private and public segments. The private total is divided into commercial and school/other segments, while the public total is separated into federal and state/county/municipal/school segments. As with trucks/tractors, all bus data is grouped by state.
Learn more
Highway Statistics Series is freely accessible at fhwa.dot.gov/policyinformation (vehicle registration data is available in Chapter 7). Industry companies may find other helpful sections throughout this publication, including chapters on infrastructure, miles traveled and fuel type. Historical files exist for about the last 20 years.
For more industry market data, visit ntea.com/marketdata.